Enzyme Kinetics
What kinetics measures
The field of biochemistry concerned with the quantitative measurement of the rates of enzyme-catalysed reactions and the systematic study of the factors that affect those rates.
Three principles carry over from Unit 5 and are worth restating because every later argument rests on them. Enzymes are not changed by the reaction they catalyse (though they may be temporarily changed during it). They do not change the equilibrium, and so cannot force a reaction that is energetically unfavourable. They increase rates by decreasing the activation energy.
One thermodynamic relationship is worth being able to state. ΔG⁰ is related to the equilibrium constant Keq: if ΔG⁰ is negative, Keq is greater than 1 and products predominate at equilibrium; if ΔG⁰ is positive, Keq is less than 1 and substrate formation is favoured. Note also that ΔG⁰ tells you nothing about the number or type of transition states a reaction passes through — thermodynamics gives the destination, kinetics gives the route.
A transient intermediate in which neither free substrate nor free product exists — written E…R…L, where the dotted lines represent the “partial” bonds undergoing simultaneous formation and rupture.
- Define enzyme kinetics → The quantitative measurement of reaction rates and the systematic study of factors affecting them
- What is the transition state? → A transient intermediate in which neither free substrate nor product exists, with partial bonds forming and breaking
- If ΔG⁰ is negative, what does Keq do? → It exceeds 1, so products predominate at equilibrium
Temperature and pH ★★
Temperature
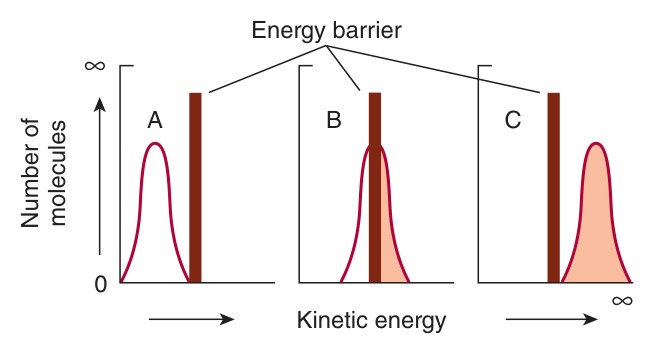
Raising the temperature does two things at once, and a full answer names both. It increases the kinetic energy of the molecules, so a larger number exceed the activation-energy barrier; and it increases their motion, and therefore the frequency of collisions. More frequent and more energetic collisions means a faster reaction.
The factor by which the rate of a biological process increases for a 10 °C rise in temperature.
But only over a limited range. Keep heating and the enzyme denatures, with a rapid loss of catalytic activity. So every enzyme has a temperature optimum at which activity is maximal — the peak of a curve, not a plateau, and the fall on the far side is much steeper than the rise on the near side because denaturation is abrupt.
pH
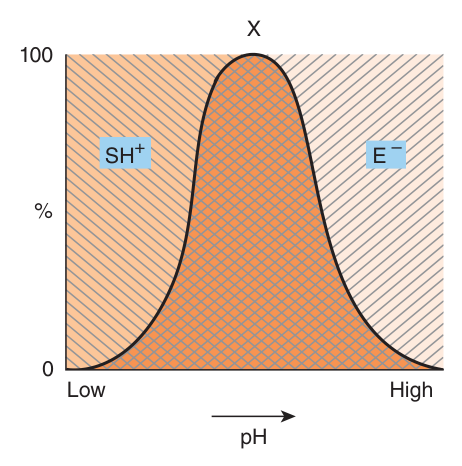
pH matters because charge matters. Harper's illustration is worth reproducing in an answer: consider a negatively charged enzyme (EH⁻) binding a positively charged substrate (SH⁺). Plot the proportion of each as a function of pH and you get two curves moving in opposite directions. Only where the two overlap do enzyme and substrate both bear the appropriate charge — and that overlap is the pH optimum.
Too acidic and the enzyme's ionisable group is protonated; too alkaline and the substrate's is deprotonated. The enzyme only works in the narrow window where both partners are in the right ionic state — and this is Unit 1's pKa and ionisation doing real work again. Extremes of pH additionally denature the protein outright.
- Define Q₁₀ → The factor by which the rate of a biological process increases for a 10 °C rise in temperature
- Why does rate fall at high temperature? → The enzyme denatures, with rapid loss of catalytic activity
- Why is the pH curve bell-shaped? → Enzyme and substrate must BOTH bear the appropriate charge, which happens only over a narrow pH range
Substrate concentration and saturation ★★★
This is the observation the whole unit exists to explain. Increase [S] and the initial velocity vi rises — but not indefinitely. It approaches a ceiling, Vmax, beyond which further substrate makes no difference. The curve is a rectangular hyperbola.
That is the whole explanation, and it is worth memorising verbatim — the phrase “no free enzyme remains available” is what earns the mark.
Why we always measure the INITIAL velocity
Rates are measured over relatively short periods, approximating initial rate conditions. There are two reasons, and both matter.
| Reason | Consequence |
|---|---|
| Only traces of product accumulate | The rate of the reverse reaction is negligible, so vi is essentially the rate of the forward reaction alone |
| Assays use a large molar excess of substrate over enzyme (10³–10⁷) | Under these conditions vi is proportional to the concentration of enzyme — which is why measuring initial velocity lets you estimate how much enzyme is present in a biological sample |
That second row is the entire basis of clinical enzymology. The reason a laboratory can report “serum ALT” at all is that, under initial-rate conditions with substrate in vast excess, rate reports enzyme quantity. Unit 5 told you enzymes are detected by their activity; this is the condition under which that detection is quantitative.
- What shape is the vi versus [S] curve? → A rectangular hyperbola approaching Vmax
- Why does velocity plateau? → At Vmax all enzyme exists as ES complex; no free enzyme remains available
- Why measure the initial velocity? → Only traces of product accumulate, so the reverse reaction is negligible
- What molar excess of substrate is used? → 10³–10⁷ fold, so that vi is proportional to enzyme concentration
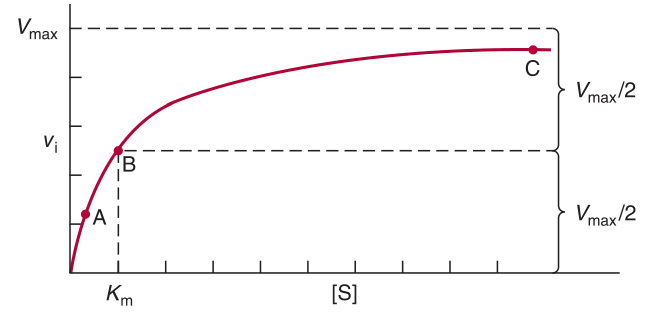
![The enzyme at [S] below K<sub>m</sub> (A), at K<sub>m</sub> (B) and well above K<sub>m</sub> (C) — at saturation no free enzyme remains available](images/bc/bc06_saturation.png)
The Michaelis–Menten equation ★★★
The first TMU study question is simply “what is the Michaelis–Menten equation?”. Write the equation, define every term, and say what it describes.
vi — initial velocity · Vmax — maximal velocity at that enzyme concentration · [S] — substrate concentration · Km — the Michaelis constant, the substrate concentration at which vi is half Vmax.
Note immediately that Km has the dimensions of substrate concentration — it is measured in mol/L, not in units of rate. Students who forget this lose marks by describing Km as a speed.
- Write the Michaelis–Menten equation → vi = Vmax[S] / (Km + [S])
- What does it describe? → The relationship between initial reaction velocity and substrate concentration
- What are the units of Km? → Those of substrate concentration (e.g. mol/L)
The three conditions — where the marks are ★★★
Harper's evaluates the equation under three conditions, and TMU turns them into MCQs. Work through each once and you will never need to memorise the results.
| Condition | The equation becomes | Meaning |
|---|---|---|
| [S] ≪ Km | Km + [S] ≈ Km, so vi ≈ (Vmax/Km) × [S] | Vmax and Km are both constants, so their ratio is a constant: vi is DIRECTLY PROPORTIONAL to [S]. This is the linear, first-order region at the start of the curve |
| [S] = Km | vi = Vmax[S] / 2[S] = Vmax/2 | The velocity is half-maximal. This is the definition of Km, and how it is measured experimentally |
| [S] ≫ Km | Km + [S] ≈ [S], so vi ≈ Vmax | The velocity is maximal and unaffected by further increases in [S] — the saturated plateau, zero-order with respect to substrate |
0.8 = [S] / (Km + [S])
0.8 Km + 0.8 [S] = [S]
0.8 Km = 0.2 [S]
[S] = 4 Km
The general shortcut: if vi is a fraction f of Vmax, then [S] = Km × f/(1−f). So 50% → 1 Km, 80% → 4 Km, 90% → 9 Km, 99% → 99 Km.
Notice what that last figure tells you: reaching true Vmax experimentally would need an impossibly high substrate concentration — which is exactly why the Lineweaver–Burk plot of §7 had to be invented.
- When [S] ≪ Km, what is vi proportional to? → Directly proportional to [S]
- When [S] = Km? → vi = Vmax/2
- When [S] ≫ Km? → vi ≈ Vmax, unaffected by further substrate
- At 80% of Vmax, what is [S]? → 4 Km
- At 90%? → 9 Km — use [S] = Km · f/(1−f)
The significance of Km ★★★
The second TMU study question asks for the significance of the equation and of Km — not just the definition. Here is what to say.
| Point | Explanation |
|---|---|
| It is defined as a concentration | Km is the substrate concentration giving half-maximal velocity, and has the dimensions of concentration |
| It is an inverse measure of affinity | A low Km means high affinity — little substrate is needed to half-saturate the enzyme. A high Km means low affinity |
| It is a constant of the enzyme–substrate pair | It is independent of enzyme concentration, and so characterises the enzyme itself. Two enzymes acting on the same substrate are distinguished by their Km values |
| It is measurable | Determined experimentally as the [S] at which vi is half-maximal, most conveniently from the x-intercept of a Lineweaver–Burk plot |
| It identifies inhibitor type | Whether an inhibitor changes Km, Vmax or both is what distinguishes competitive from non-competitive inhibition (§10) |
• the nature of the enzyme (and of the substrate)
• the temperature
• the pH
• the presence of a competitive inhibitor (which raises the apparent Km)
It is NOT affected by:
• the concentration of enzyme — this changes Vmax, not Km
• the duration of the reaction
• the substrate concentration itself
A note on your slide: slide 45 prints this as a single-answer MCQ but lists several individually true options (nature of enzyme, temperature, pH). Treat it as a list to know in both directions — the discriminating fact the examiner is almost certainly after is that enzyme concentration does not affect Km.
Add more enzyme and every ES complex still behaves the same way — you simply have more of them, so Vmax rises. But the substrate concentration needed to half-occupy the enzyme is a property of the binding, not of how much enzyme is in the tube. That is why Km is a genuine constant that identifies an enzyme, and Vmax is not.
The clearest demonstration that Km is not an abstraction. Hexokinase in most tissues has a low Km for glucose, so it is saturated and working flat out even at low blood glucose — the tissue always gets its glucose. Glucokinase in liver has a high Km, so it only becomes active when blood glucose is high — after a meal — which is precisely when the liver should be storing glucose rather than competing with the brain for it.
Same reaction, two Km values, two completely different physiological roles. You will meet this pair properly in Units 10 and 13.
- Define Km → The substrate concentration at which vi is half of Vmax
- Does a low Km mean high or low affinity? → HIGH affinity
- Does enzyme concentration affect Km? → No — it affects Vmax
- Name three things that DO affect Km → The nature of the enzyme/substrate, temperature, pH (and a competitive inhibitor raises the apparent Km)
The Lineweaver–Burk plot ★★★
There is a practical problem with the hyperbola: measuring Vmax directly requires impractically high substrate concentrations — as §5 showed, even 99% of Vmax needs 99 Km. The solution is to turn the curve into a straight line, because a straight line can be extrapolated.
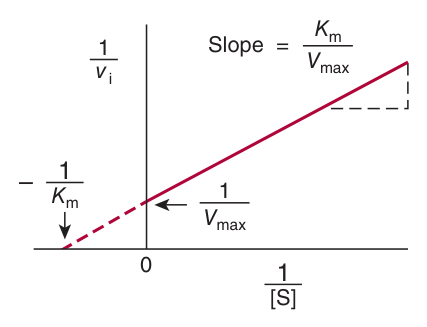
Invert the Michaelis–Menten equation and rearrange, and you get the equation of a straight line, y = ax + b:
| Feature of the plot | Value |
|---|---|
| y-intercept | 1 / Vmax |
| Slope | Km / Vmax |
| x-intercept | −1 / Km |
Km can be calculated from the slope and y-intercept, but Harper's notes it is most readily calculated from the negative x-intercept. And its greatest virtue is not measuring constants at all — it is the ease with which it identifies the kinetic mechanism of an inhibitor, which is §10.
Double-reciprocal plots can be biased by clustering of data at low values of 1/[S]. The laboratory fix is to prepare substrate dilutions of 1:2, 1:3, 1:4, 1:5 and so on, so that the points fall at equally spaced intervals along the 1/[S] axis. Alternatively use a single-reciprocal plot — the Eadie–Hofstee (vi vs vi/[S]) or Hanes–Woolf ([S]/vi vs [S]).
- What is plotted on a Lineweaver–Burk plot? → 1/vi against 1/[S]
- What are the three key values? → y-intercept = 1/Vmax; slope = Km/Vmax; x-intercept = −1/Km
- Why is it needed at all? → Measuring Vmax directly needs impractically high [S]; a straight line can be extrapolated
- What is its greatest virtue? → Determining the kinetic mechanism of an enzyme inhibitor
kcat and catalytic efficiency ★★
Three related measures, in increasing order of rigour. Each answers “how active is this enzyme?” for a different quality of preparation.
| Measure | Definition | Used when |
|---|---|---|
| Specific activity | Vmax ÷ protein concentration | The preparation is impure |
| Turnover number | Vmax ÷ moles of enzyme present | The enzyme is homogeneous |
| Catalytic constant, kcat | Vmax ÷ number of active sites (St) | The number of active sites is known — the best expression. Units are reciprocal time, since concentration units cancel |
The ratio of the catalytic constant to the Michaelis constant, and the best single measure for comparing different enzymes, different substrates for one enzyme, or the forward and reverse directions of one reaction.
The reason it is a ratio: a high kcat tells you the enzyme can process substrate quickly, but the benefit of a high kcat can only be realised if Km is sufficiently low — that is, if the enzyme can actually capture substrate at physiological concentrations. Speed is useless without affinity.
For some enzymes, once substrate binds it is converted and released so fast that those events are effectively instantaneous — so the rate-limiting step becomes the formation of the ES complex itself. Such enzymes are called diffusion-limited or “catalytically perfect”, because the fastest possible rate is now set by how quickly molecules can diffuse through the solution. Evolution cannot improve them further without changing the laws of physics.
- Define specific activity → Vmax divided by protein concentration — for impure preparations
- Define kcat → Vmax divided by the number of active sites; units of reciprocal time
- What is catalytic efficiency? → kcat/Km — because a high kcat only helps if Km is low
- What is a diffusion-limited enzyme? → One so fast that ES formation is rate-limiting — 'catalytically perfect'
Cooperative enzymes and the Hill plot
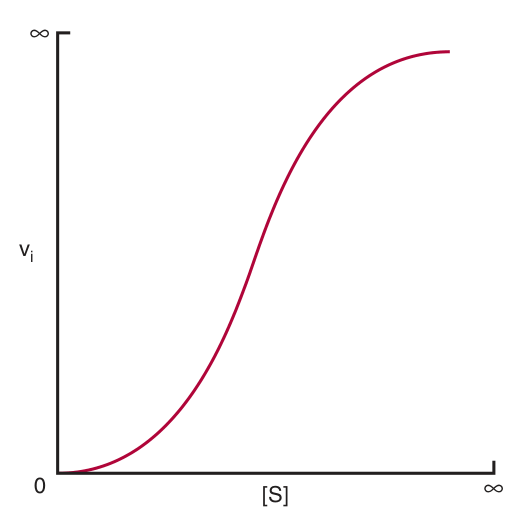
Not every enzyme gives a hyperbola. For enzymes showing positive cooperativity in substrate binding, the plot of vi against [S] is sigmoid — exactly like haemoglobin's oxygen curve in Unit 4, and for exactly the same reason.
Enzymologists instead use a graphical form of the Hill equation, originally derived to describe the cooperative binding of O₂ by haemoglobin.
| Feature of the Hill plot | Detail |
|---|---|
| What is plotted | log [vi/(Vmax − vi)] against log [S], which gives a straight line |
| The slope, n | The Hill coefficient — an empirical parameter whose value is a function of the number, kind and strength of the interactions between the multiple substrate-binding sites. The greater n, the higher the degree of cooperativity and the more sigmoid the vi vs [S] plot |
| S₅₀ | Dropping a perpendicular from the point where the y term equals zero gives, on the x-axis, the substrate concentration producing half-maximal velocity |
In Unit 4 you learned P₅₀: the partial pressure of O₂ at which haemoglobin is half-saturated. S₅₀ is the identical idea for a cooperative enzyme — the substrate concentration giving half-maximal velocity. Both exist because a sigmoid curve has no Km in the Michaelis–Menten sense, so a different half-saturation parameter is needed. Same problem, same solution, two chapters apart.
- What shape is the curve for a cooperative enzyme? → Sigmoid
- Why can Michaelis–Menten not be used? → It assumes independent binding sites, which cooperativity violates
- What is plotted on a Hill plot? → log[vi/(Vmax − vi)] against log[S]
- What does the Hill coefficient measure? → The degree of cooperativity — the number, kind and strength of interactions between binding sites
- What is S₅₀? → The substrate concentration giving half-maximal velocity
Enzyme inhibition ★★★
The third TMU study question — compare competitive and non-competitive inhibitors — and the single most examinable table in the unit. Learn the five rows; they come straight from the lecture.
| Competitive inhibitor | Non-competitive inhibitor | |
|---|---|---|
| Structure | Resembles the substrate — a “substrate analogue” | Little or no structural resemblance to the substrate |
| Binding site | The active site (the substrate-binding portion), blocking substrate access | A site distinct from the substrate-binding site; may bind either E or ES |
| Effect of raising [S] | Overcomes the inhibition | Cannot overcome the inhibition |
| Km | INCREASED (the apparent Km, K′m) | UNCHANGED |
| Vmax | UNCHANGED | DECREASED |
Why each column behaves as it does
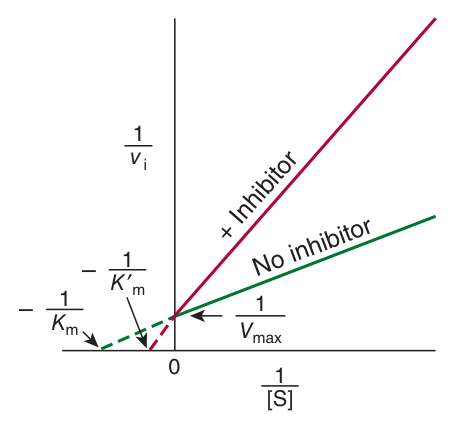
Competitive. The inhibitor and the substrate compete for the same site, so they exert reciprocal effects: forming ES removes free enzyme available to bind inhibitor, so raising [S] decreases [EI] and raises the velocity. Because enough substrate can always outcompete the inhibitor, Vmax is still attainable — you simply need more substrate to get there, which is exactly what a raised apparent Km means. In effect the inhibitor acts by decreasing the number of free enzyme molecules available to form ES.
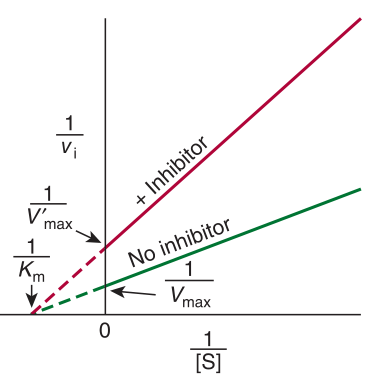
Non-competitive. Because the inhibitor binds elsewhere, its binding does not affect substrate binding — hence Km is unchanged. But the EI complex, while it can still bind substrate, is less efficient at transforming substrate into product, and that is what a reduced Vmax reports. Adding substrate cannot help, because the problem was never one of access.
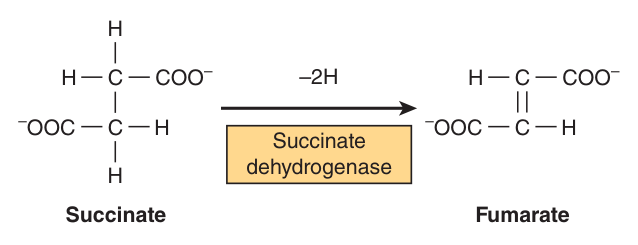
But malonate contains only one methylene carbon, so it cannot undergo dehydrogenation. It occupies the site and does nothing. Raising the succinate concentration displaces it and restores the rate — the defining behaviour of a competitive inhibitor.
This is the single most quoted example in biochemistry, and the detail that earns the mark is why malonate cannot react: one methylene carbon instead of two.
Reading a double-reciprocal plot — how to tell them apart
| Inhibitor | What the lines do on a Lineweaver–Burk plot |
|---|---|
| Competitive | Lines converge on the y-axis. Since the y-intercept is 1/Vmax, Vmax is unaffected. The x-intercept moves with inhibitor concentration — because −1/K′m is smaller than −1/Km, the apparent Km rises |
| Non-competitive | Lines converge on the x-axis: Km unchanged, but the y-intercept rises, so Vmax falls |
Measuring inhibitor potency
| Measure | Meaning |
|---|---|
| Ki | The equilibrium constant for dissociation of the EI complex. The lower the Ki, the more effective the inhibitor. Used to compare different inhibitors of the same enzyme; calculable from the x-intercept once Km is known |
| IC₅₀ | The concentration of inhibitor producing 50% inhibition. A less rigorous alternative to Ki, because unlike the equilibrium constant its numerical value varies with the conditions — substrate concentration and so on — under which it is measured |
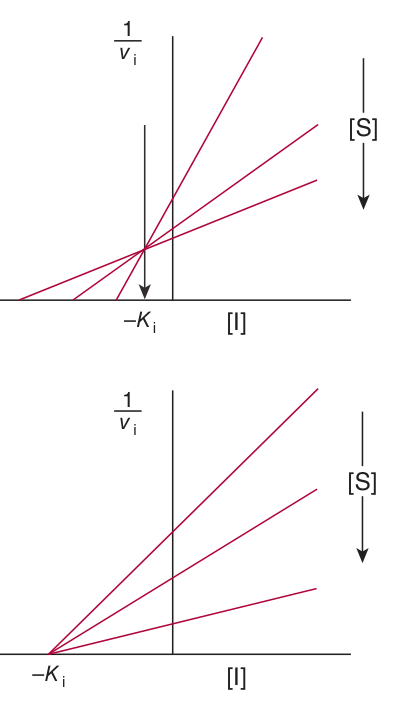
| Dixon plot | 1/vi against [I] at a fixed [S], repeated at several fixed [S]. The lines intersect to the left of the y-axis, and a perpendicular to the x-axis gives −Ki. Common in pharmaceutical publications |
Irreversible inhibitors
Inhibitors that act irreversibly by chemically modifying the enzyme — generally by making or breaking covalent bonds with aminoacyl residues essential for substrate binding, catalysis, or maintenance of the enzyme's functional conformation.
Because these covalent changes are relatively stable, an enzyme “poisoned” by an irreversible inhibitor — a heavy metal atom, an acylating reagent — remains inhibited even after the inhibitor is removed from the surrounding medium. This is the key contrast with competitive and non-competitive inhibitors, which form dissociable complexes and from which fully active enzyme is recovered simply by washing the inhibitor away.
“Mechanism-based” or “suicide” inhibitors are specialised substrate analogues carrying a chemical group that the target enzyme's own catalytic machinery transforms — into a species that then attacks the enzyme irreversibly. The enzyme, in other words, activates its own poison.
The attraction is specificity: only the enzyme that can perform that chemistry can be inhibited, so off-target effects are minimal. Note also from Unit 5 the related idea of transition state analogues, and note that the statins are competitive inhibitors of HMG-CoA reductase — a fact that will return in Unit 19.
- Competitive inhibitor — effect on Km and Vmax? → Km increased, Vmax unchanged
- Non-competitive — effect on Km and Vmax? → Km unchanged, Vmax decreased
- Which can be overcome by raising [S]? → Competitive only
- Give the classic competitive example → Malonate inhibiting succinate dehydrogenase — it has only one methylene carbon so cannot be dehydrogenated
- Where do the lines converge for a competitive inhibitor? → On the y-axis (Vmax unchanged)
- What does a low Ki mean? → A more effective inhibitor
- How does irreversible inhibition differ? → It modifies the enzyme covalently, so activity is not restored by removing the inhibitor
Revision layer
Three study questions on this deck, and four printed MCQs. This unit rewards being able to do things — write the equation, evaluate it under three conditions, calculate an [S] from a percentage of Vmax, and read a double-reciprocal plot.
The equations to be able to write
| Name | Equation |
|---|---|
| Michaelis–Menten | vi = Vmax[S] / (Km + [S]) |
| Lineweaver–Burk | 1/vi = (Km/Vmax)(1/[S]) + 1/Vmax |
| Catalytic constant | kcat = Vmax / St (number of active sites) |
| Catalytic efficiency | kcat / Km |
| The [S] shortcut | [S] = Km × f/(1−f), where f is the fraction of Vmax |
The three conditions
| Condition | Result |
|---|---|
| [S] ≪ Km | vi directly proportional to [S] |
| [S] = Km | vi = Vmax/2 — the definition of Km |
| [S] ≫ Km | vi ≈ Vmax, independent of [S] |
Competitive versus non-competitive — the master table
| Competitive | Non-competitive | |
|---|---|---|
| Structure of inhibitor | Resembles substrate | Does not resemble substrate |
| Binding site | Active site | Site other than the active site |
| Increasing [S] | Overcomes inhibition | Cannot overcome inhibition |
| Km | Increased | Unchanged |
| Vmax | Unchanged | Decreased |
| Lineweaver–Burk lines converge on | the y-axis | the x-axis |
| Example | Malonate vs succinate dehydrogenase; statins vs HMG-CoA reductase | — |
Definitions from this unit — Section I material
| Term | Definition |
|---|---|
| Enzyme kinetics | The quantitative measurement of the rates of enzyme-catalysed reactions and the systematic study of the factors affecting those rates |
| Km (the Michaelis constant) | The substrate concentration at which the initial velocity is half of the maximal velocity attainable at that enzyme concentration; it has the dimensions of substrate concentration, is independent of enzyme concentration, and varies inversely with the enzyme's affinity for its substrate |
| Vmax | The maximal initial velocity attainable at a given enzyme concentration, reached when all the enzyme is present as ES complex and no free enzyme remains available |
| The Michaelis–Menten equation | vi = Vmax[S]/(Km + [S]) — the mathematical expression of the relationship between initial reaction velocity and substrate concentration |
| Q₁₀ (temperature coefficient) | The factor by which the rate of a biological process increases for a 10 °C rise in temperature |
| Competitive inhibition | Reversible inhibition in which an inhibitor structurally resembling the substrate binds the active site, blocking substrate access; it raises the apparent Km without altering Vmax, and is overcome by raising [S] |
| Non-competitive inhibition | Reversible inhibition in which an inhibitor bearing little resemblance to the substrate binds at a site distinct from the active site, binding either E or ES; Km is unchanged but Vmax is decreased, and the inhibition cannot be overcome by raising [S] |
| Irreversible inhibition | Inhibition by chemical modification of the enzyme — making or breaking covalent bonds with residues essential for substrate binding, catalysis or conformation — so that activity is not restored by removing the inhibitor |
| Ki | The equilibrium dissociation constant of the enzyme-inhibitor complex; the lower the Ki, the more effective the inhibitor |
| IC₅₀ | The concentration of inhibitor producing 50% inhibition; a less rigorous measure than Ki because its value varies with the conditions of measurement |
| Catalytic efficiency | The ratio kcat/Km, the best measure for comparing enzymes, since a high kcat is only beneficial if Km is sufficiently low |
Numbers worth carrying in
| Item | Value |
|---|---|
| Molar excess of substrate over enzyme in assays | 10³–10⁷ |
| [S] for 50% Vmax | 1 Km |
| [S] for 80% Vmax | 4 Km |
| [S] for 90% Vmax | 9 Km |
| [S] for 99% Vmax | 99 Km |
| Lineweaver–Burk y-intercept / slope / x-intercept | 1/Vmax · Km/Vmax · −1/Km |
| “Tightly bound” inhibitor | Ki ≤ 10⁻⁹ M |
- Write the Michaelis–Menten equation and define every term
- Evaluate it under all three conditions and state what each means
- Calculate [S] for any given fraction of Vmax
- Give five points on the significance of Km, including what does and does not change it
- Draw a Lineweaver–Burk plot and label all three key values
- Reproduce the competitive vs non-competitive table from memory
- Explain malonate and succinate dehydrogenase, including why malonate cannot react
- Distinguish Ki from IC₅₀, and reversible from irreversible inhibition