Cardiovascular Physiology
Cardiac Electrophysiology
Your heart beats about 100,000 times a day, every day, with no rest and no conscious control. To understand how a chunk of muscle can do that, you have to know that the heart is really two muscles fused into one organ. The working myocardium — atrial and ventricular myocytes — is what squeezes blood. But scattered among these cells, in highly specialised clusters, is the conducting/pacemaker system: the SA node, AV node, His bundle, Purkinje fibres. These cells barely contract; their job is to fire spontaneously and propagate the signal at exactly the right speed to every working cell. The heart can keep beating after every nerve to it is cut precisely because its own pacemaker is built in.
Four properties describe what cardiac cells do: excitability (they can fire an AP), autorhythmicity (pacemaker cells fire on their own), conductivity (the signal spreads through gap junctions), and contractility (the mechanical squeeze). Two different action potentials underlie them — a fast-response AP in working cells (powered by fast Na⁺ channels, like a neuron) and a slow-response AP in pacemaker cells (powered by L-type Ca²⁺ channels). Get those two AP shapes into your head and almost every arrhythmia drug action makes sense.
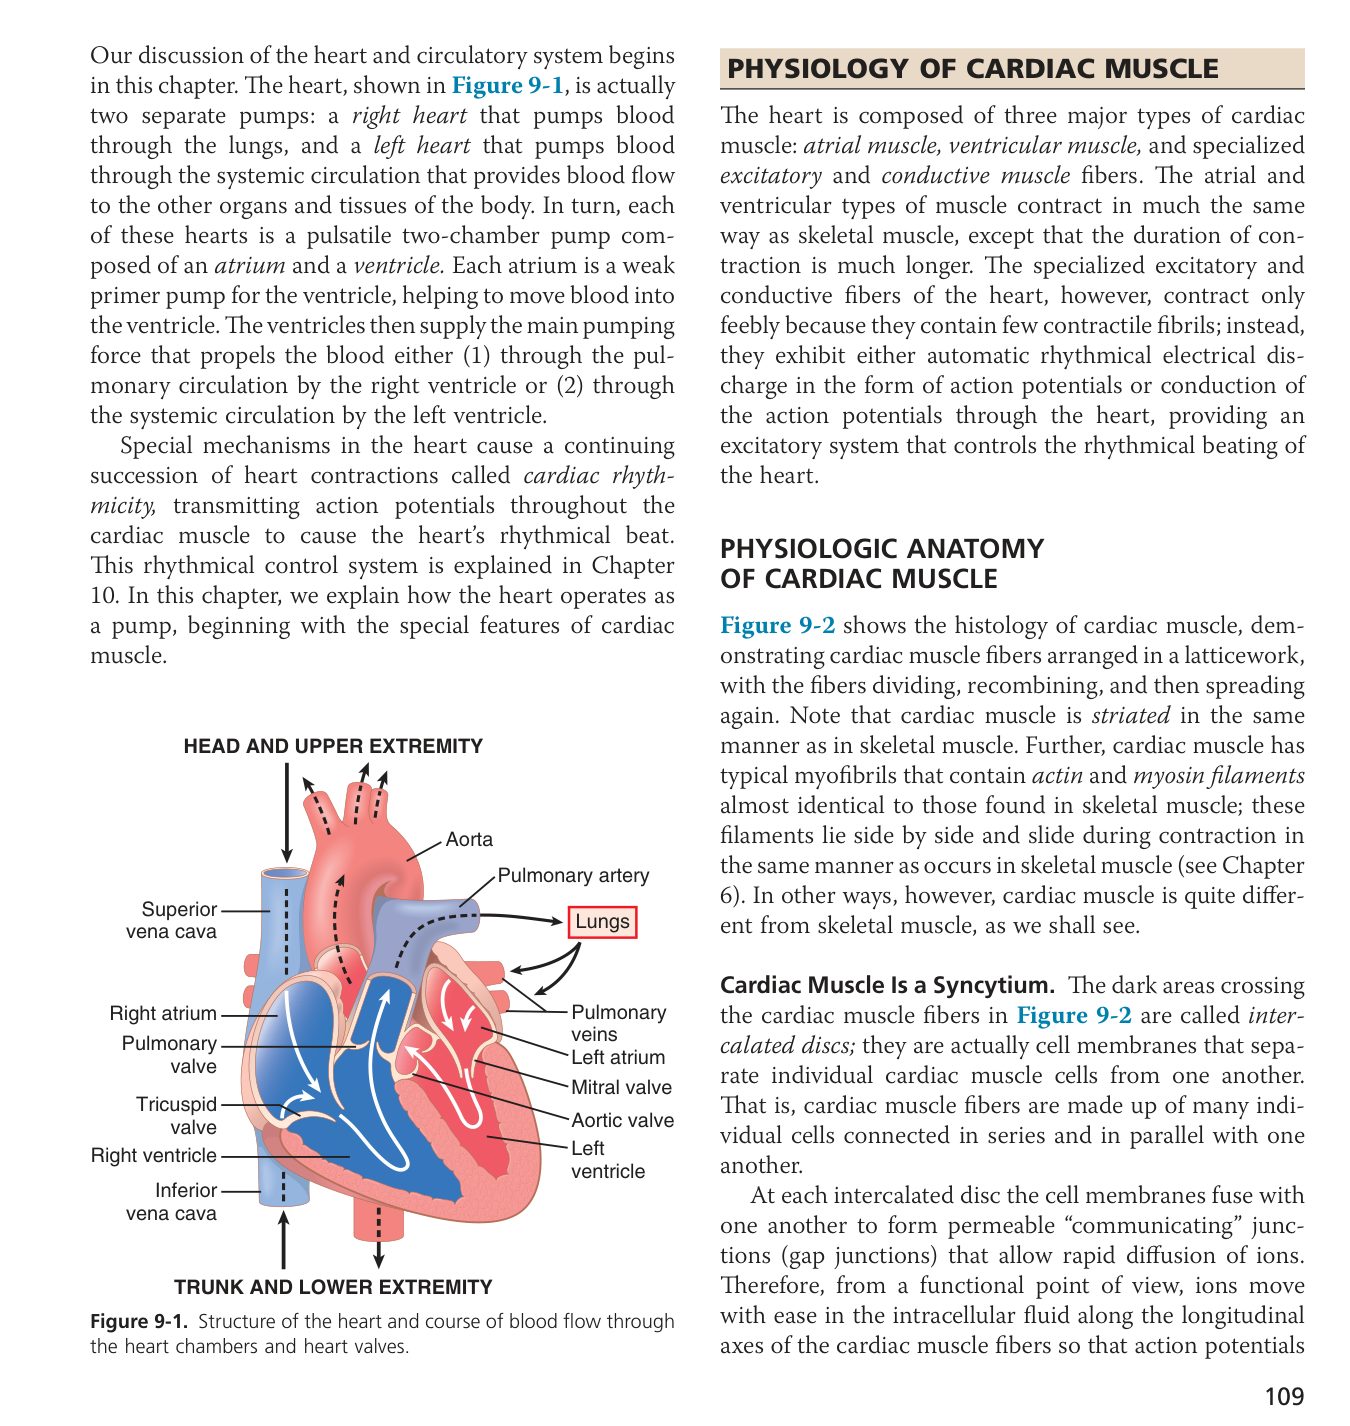
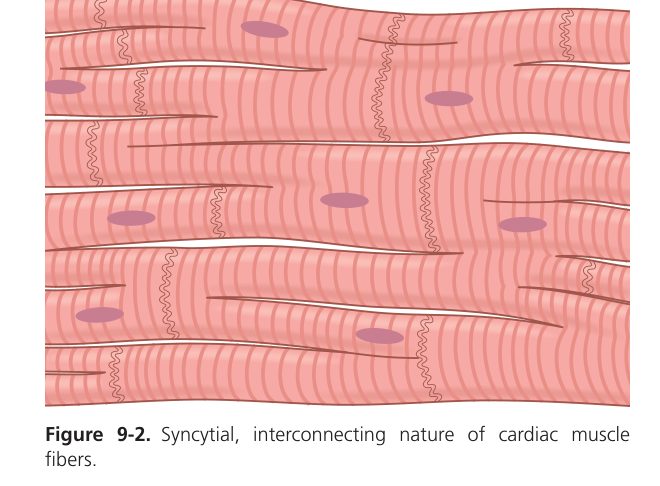
The four electrophysiological properties of cardiac muscle are excitability, autorhythmicity (automaticity), conductivity (and contractility = the mechanical property). Cells are classed by their action potential:
| Cell | Type | Phase 0 carried by |
|---|---|---|
| Ventricular/atrial myocyte, Purkinje | Fast-response (Purkinje = fast-response rhythmic) | Fast voltage-gated Na⁺ channel |
| SA node, AV node (P cells) | Slow-response rhythmic | L-type Ca²⁺ channel (no fast Na⁺) |
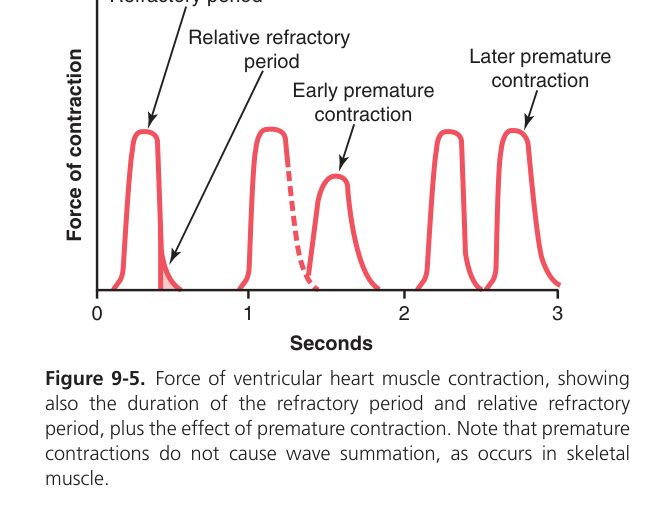
The ventricular AP looks like a neuron’s upstroke followed by a plateau before it comes down — and that plateau is the single most important difference. It lasts ~200–300 ms, which is roughly the duration of one whole heartbeat. During this plateau the cell cannot fire again. That means cardiac muscle cannot be tetanised — it cannot stay in sustained contraction. Imagine if it could: the ventricle would clamp shut, no blood would move, and you would die in seconds. The plateau is a safety lock that forces relaxation between every beat. It exists because Ca²⁺ flowing in (through L-type channels) balances K⁺ flowing out, holding the voltage near zero. This same Ca²⁺ influx is what triggers SR release for contraction — an electrical phase and a mechanical event in one elegant trick.
| Phase | Event | Ionic basis |
|---|---|---|
| 0 Upstroke | Rapid depolarisation | Fast Na⁺ influx |
| 1 Early repol. | Small notch | Transient K⁺ out (Iₜₒ) + Na⁺ inactivation |
| 2 Plateau | Sustained depolarisation (the hallmark) | Ca²⁺ influx (L-type) balanced by K⁺ efflux |
| 3 Repolarisation | Return to rest | K⁺ efflux (Ca²⁺ channels close) |
| 4 Resting | −90 mV maintained | Na⁺/K⁺-ATPase + Na⁺-Ca²⁺ exchange restore gradients |
The long plateau (phase 2) makes the cardiac AP last ~200–300 ms — the basis of the long refractory period and the Ca²⁺ entry that triggers contraction.
Pacemaker cells never sit still. As soon as one AP ends, the membrane begins to drift back toward threshold all by itself, because of a slow Na⁺ leak called the funny current (Iᶠ) — "funny" because it’s the opposite of every other voltage-gated current (it opens on hyperpolarisation). This drift is what makes the SA node fire at its own rhythm of ~70–80 times per minute, the natural pacemaker of the heart. Drugs and nerves change how steeply this drift climbs: sympathetic noradrenaline steepens it (faster heartbeat); vagal acetylcholine flattens it (slower heartbeat). That single mechanism is the basis of every heart-rate change you will see clinically.
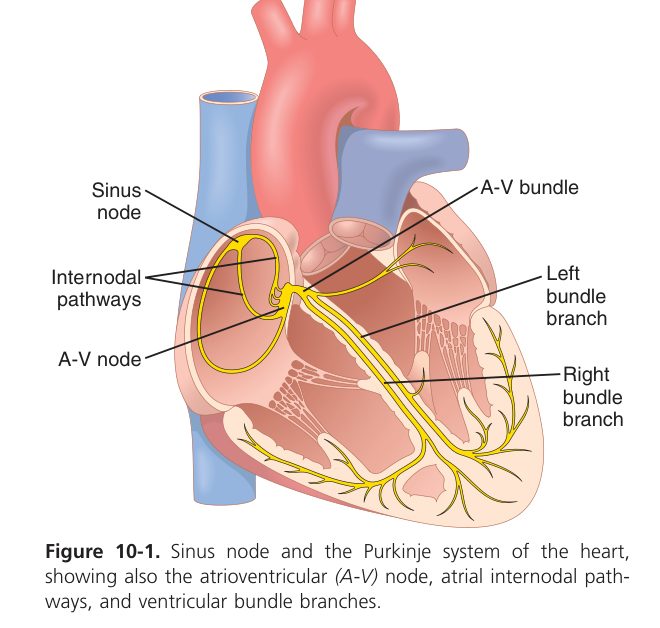
- No stable resting potential — the maximum diastolic potential (~−60 mV) slowly drifts up.
- Phase 4 (spontaneous/diastolic depolarisation): the funny current Iᶠ (Na⁺ inward, activated by hyperpolarisation) plus T-type Ca²⁺ → slow drift to threshold → automaticity.
- Phase 0: slow upstroke carried by the L-type Ca²⁺ channel (not Na⁺) → slow conduction.
- Phase 3: K⁺ efflux repolarises.
Intrinsic rates: SA node (~100/min, fastest) > AV node (~50) > bundle/Purkinje (~25–40). The fastest (SA) drives the heart = normal pacemaker; the rest are latent (ectopic) pacemakers suppressed by overdrive. (In vivo SA ~75/min due to vagal tone.)
| Period | Phase / voltage | Response to stimulus |
|---|---|---|
| Effective refractory period (ERP) | Phase 0–early 3 | No propagated AP (Na⁺ channels inactivated) — only a local response at the end |
| Relative refractory period (RRP) | Phase 3 (~−60 mV) | A smaller-than-normal AP can fire if the stimulus is larger than normal |
| Supranormal period (SNP) | Late phase 3 (~−80 to −90 mV) | Excitability > normal — a slightly smaller stimulus fires an AP |
The ERP is very long (lasts almost the whole contraction), so cardiac muscle cannot be tetanised — it must relax (fill) between beats. This is why the heart pumps rhythmically and never goes into sustained contraction. The RRP/SNP are when premature beats and re-entrant arrhythmias can be triggered.
• Phase 0 of ventricular AP carried by? → fast Na⁺ influx
• What is the plateau (phase 2)? → Ca²⁺ in vs K⁺ out — gives long refractory period, prevents tetanus
• Why does the SA node fire spontaneously? → Iᶠ ("funny" Na⁺ current) + T-Ca²⁺ cause phase-4 drift to threshold
• Pacemaker hierarchy? → SA (70-80/min) > AV (40-60) > Purkinje (15-40)
• Why an AV-node delay? → lets atrial systole fill ventricles before ventricular systole
The Cardiac Cycle
One heartbeat is a sequence with a strict logic, and once you see the logic the lub-dub and the four pressures and the murmurs all make sense at once. The heart is a pair of pumps that must fill at low pressure (diastole) and eject at high pressure (systole), with one-way valves that snap shut at exactly the right moment to prevent backflow. The valves cannot think; they open and close passively whenever pressure on one side exceeds the other. That single rule explains every phase of the cardiac cycle. Trace the left side: pressure in the atrium rises above the ventricle → mitral valve opens → ventricle fills; ventricle contracts → pressure rises above atrium → mitral slams shut (the first heart sound, S1) but isn’t yet above aortic → isovolumic contraction; ventricle finally exceeds aortic → aortic opens, blood ejects; relaxation → aortic pressure now exceeds ventricle → aortic slams shut (S2); ventricle keeps relaxing but isn’t yet below atrium → isovolumic relaxation; eventually opens again → new cycle.
Atrial systole is the easily forgotten part: it adds the last ~20-30% of filling, the atrial kick. Healthy young hearts can manage without it (e.g. in atrial fibrillation, AFib), but stiff old ventricles need it — this is why AFib commonly precipitates heart failure in the elderly.
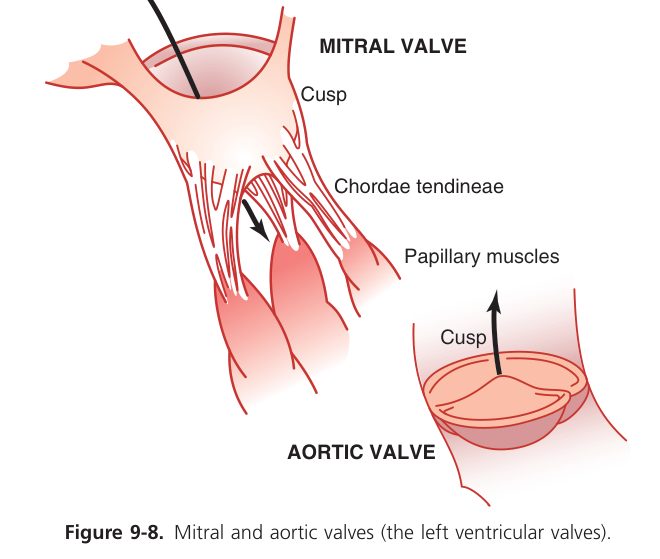
One cycle (~0.8 s at HR 75) = systole (contraction) + diastole (relaxation/filling). One-way flow is enforced by the AV and semilunar valves.
| Phase | Valves | Pressure relationship | Key point |
|---|---|---|---|
| Atrial systole | AV open, SL closed | LA > LV | Adds ~20–30% of ventricular filling ("atrial kick") |
| Isovolumic contraction | All closed | LA < LV < aorta | Pressure rises fastest; volume constant; S₁ begins |
| Rapid ejection | SL open | LV > aorta | Ventricular pressure peaks; SBP = aortic pressure |
| Slow ejection | SL open | LV slightly < aorta | Flow continues by momentum |
| Isovolumic relaxation | All closed | LV falls below aorta | SL valves close (S₂); pressure drops fastest |
| Rapid + slow filling | AV open | LA > LV | AV valves open at end of isovolumic relaxation; longest phase |
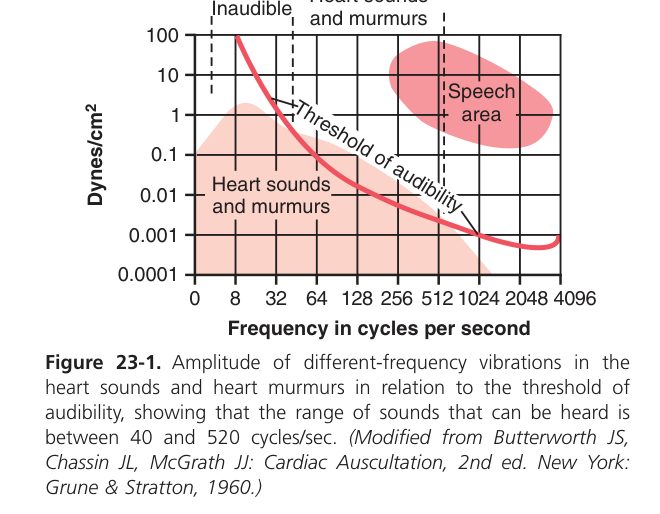
- S₁ (first heart sound): closure of the AV valves — marks the start of systole (low-pitched, long).
- S₂ (second heart sound): closure of the semilunar valves — marks the start of diastole (high-pitched, short).
Cardiac cycle = one complete sequence of contraction & relaxation of the heart. Isovolumetric contraction = the phase when the ventricle contracts with all valves closed, so pressure rises but volume is unchanged.
• In isovolumic contraction, what's happening? → all four valves shut, ventricle pressure rising, no volume change
• Atrial kick is what fraction of filling? → ~20-30% — lost in atrial fibrillation
• Longest single phase at rest? → ventricular filling (mid + diastasis)
• At HR 75/min, one cycle takes? → ~0.8 s
Cardiac Output & Its Regulation
If the heart were a delivery van, cardiac output is how many litres of blood it delivers per minute. It is the single most important number in cardiovascular physiology, because every other organ depends on the flow it receives. The arithmetic is trivial — output = volume per beat × beats per minute — but the implications are vast. Increase either stroke volume or heart rate (or both, as in exercise) and tissues get more O₂ and fuel. Decrease either (heart failure, blood loss) and tissues starve. Healthy resting adults move about 5 L/min, which equals the entire blood volume in roughly a minute — a remarkable turnover for a tissue weighing 300 g.
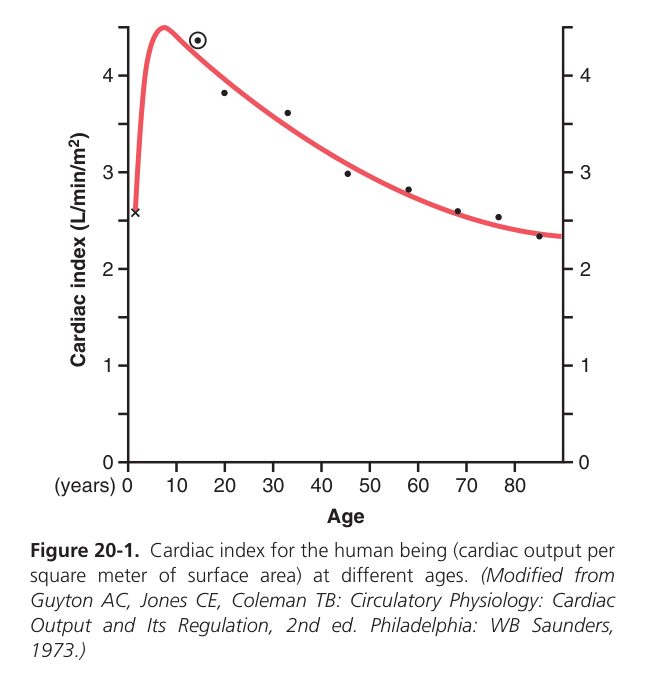
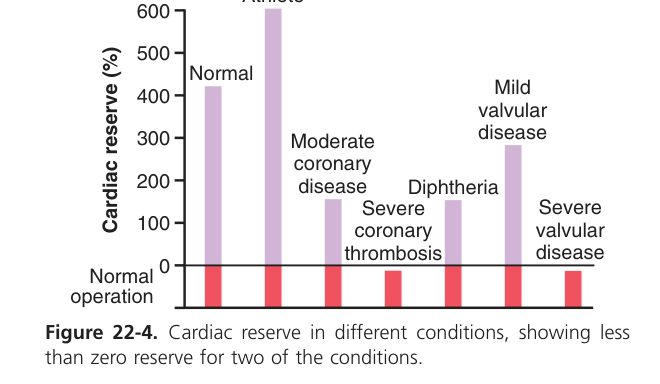
Because larger bodies need more output, comparing people uses the cardiac index — CO normalised to body surface area (~3 L/min/m²). And the body keeps an enormous safety margin: maximum CO during heavy exercise can hit 20–25 L/min in an athlete, four to five times resting. That headroom is the cardiac reserve, and it’s the single number that defines fitness on one end and heart failure on the other.
| Term | Definition | Typical |
|---|---|---|
| Stroke volume (SV) | Blood ejected per ventricle per beat | ~70 mL |
| Ejection fraction (EF) | SV / EDV — an index of contractility | ~55–65% |
| Cardiac reserve | Max ÷ resting CO capacity | ~400% (CO can rise ~5×) |
| Cardiac index | CO per m² body surface area | Peaks at ~10 years old |
Stroke volume is set by three quantities you must learn the meaning of: preload, contractility, and afterload. Preload is how stretched the ventricle is at the end of filling — the more it stretches, the harder it snaps back, by the Frank-Starling law. Think of a rubber band: pull it further, it recoils more. This is how the heart automatically matches output to venous return — bigger filling, bigger ejection, breath by breath. Contractility is intrinsic strength independent of stretch; sympathetic noradrenaline raises it (more Ca²⁺ per beat), most drugs that reduce it (β-blockers, Ca-channel blockers) work the opposite way. Afterload is the pressure the ventricle must work against to eject — mainly aortic pressure. Raise afterload (hypertension, aortic stenosis) and stroke volume falls if everything else stays the same. Every drug in heart failure manipulates one of these three.
| Factor | Definition | Mechanism / regulation |
|---|---|---|
| Preload | = end-diastolic volume (set by venous return) | Frank–Starling = heterometric regulation (more stretch → stronger contraction) |
| Afterload | = aortic/arterial pressure the ventricle ejects against | ↑afterload → ↓SV (resistance to ejection) |
| Contractility | Inotropy independent of length | Homometric regulation (e.g. sympathetic, Ca²⁺, adrenaline) |
| Heart rate | Beats/min | ↑HR ↑CO — but >170–180/min → filling time too short → ↓CO |
Within limits, the greater the end-diastolic fibre length (preload), the stronger the contraction & the larger the stroke volume — the heart pumps out whatever venous return it receives. (Same length–tension principle as skeletal muscle, Unit 2.)
The left ventricle does more work than the right because its afterload (aortic pressure ~120 mmHg) is far higher than the pulmonary pressure — hence its thicker wall. In heart failure the Frank–Starling curve is depressed; sympathetic drive (homometric) and fluid retention (preload) compensate but eventually fail.
• Three determinants of SV? → preload, contractility, afterload
• Frank-Starling law? → more end-diastolic stretch → stronger contraction → greater SV
• What is cardiac reserve? → the headroom between resting and max CO (4-5× in athletes, lost in heart failure)
• Why does HR > 180 reduce CO? → diastole shortens too much → ventricle can’t fill
The Electrocardiogram (ECG)
The electrocardiogram is a recording made from the body surface that picks up the tiny voltage changes spreading across the heart with every beat. It is the cheapest, fastest window into the heart you will ever have. The pattern is always the same in a healthy person: a small bump (P wave) when the atria depolarise; a sharp spike-and-trough (QRS complex) when the ventricles depolarise; a rounded wave (T wave) when the ventricles repolarise. The atrial repolarisation is buried inside the QRS — you don’t see it. Reading an ECG is therefore reading three things in sequence: the rhythm (regular?), the rate (HR), and the morphology of those waves (do they look like they should?). Every diagnosis — AFib, heart block, MI, hyperkalaemia — comes down to a deviation in those three.
| Deflection | Represents |
|---|---|
| P wave | Atrial depolarisation |
| QRS complex | Ventricular depolarisation (atrial repolarisation hidden) |
| T wave | Ventricular repolarisation |
| PR interval | Atrial depolarisation + AV nodal delay (start P → start QRS) |
| ST segment | End of QRS → beginning of T wave (ventricles fully depolarised = plateau) |
| QT interval | Total ventricular depolarisation + repolarisation |
ST elevation/depression signals myocardial injury/ischaemia (e.g. STEMI). A widened/absent P or prolonged PR points to conduction block; an absent P with irregular QRS suggests atrial fibrillation.
• QRS =? → ventricular depolarisation (hides atrial repolarisation)
• T wave =? → ventricular repolarisation
• PR interval =? → conduction through atria + AV-node delay (0.12-0.20 s)
• ST elevation suggests? → acute myocardial injury (STEMI)
• S1 vs S2 in time? → S1 at start of systole (AV close); S2 at start of diastole (SL close)
Vascular Physiology & Blood Pressure
All vessels carry blood, but they are not interchangeable. The vascular tree is a sequence of specialised regions, each shaped to do one job. The large elastic arteries (aorta, pulmonary trunk) act as a pressure reservoir — they bulge during ejection and recoil during diastole, smoothing the pulsatile output of the heart into nearly steady flow downstream (the Windkessel principle). The arterioles are the body's taps: tiny, muscular, and so heavily controlled that they account for the biggest pressure drop in the entire circulation. Open them and flow surges; close them and flow stops. Almost every blood-pressure drug acts somewhere in the arteriolar wall. The capillaries are one cell thick, just thin enough for O₂, CO₂, glucose and water to cross. And the veins are the body's blood reservoir — thin-walled and compliant, they hold an astonishing 60-70% of your total blood volume, waiting to be called back to the heart when output demand rises.
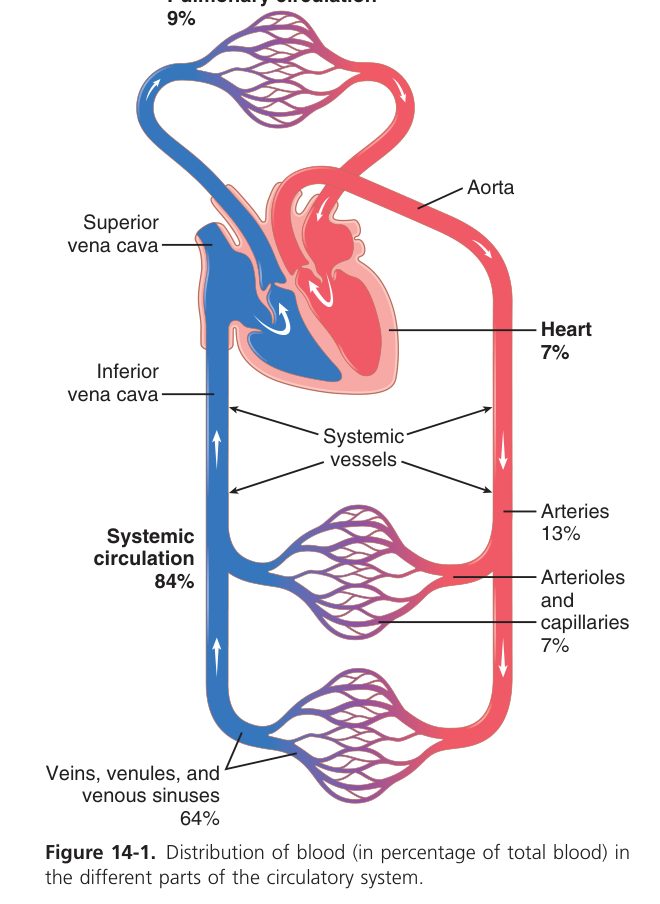
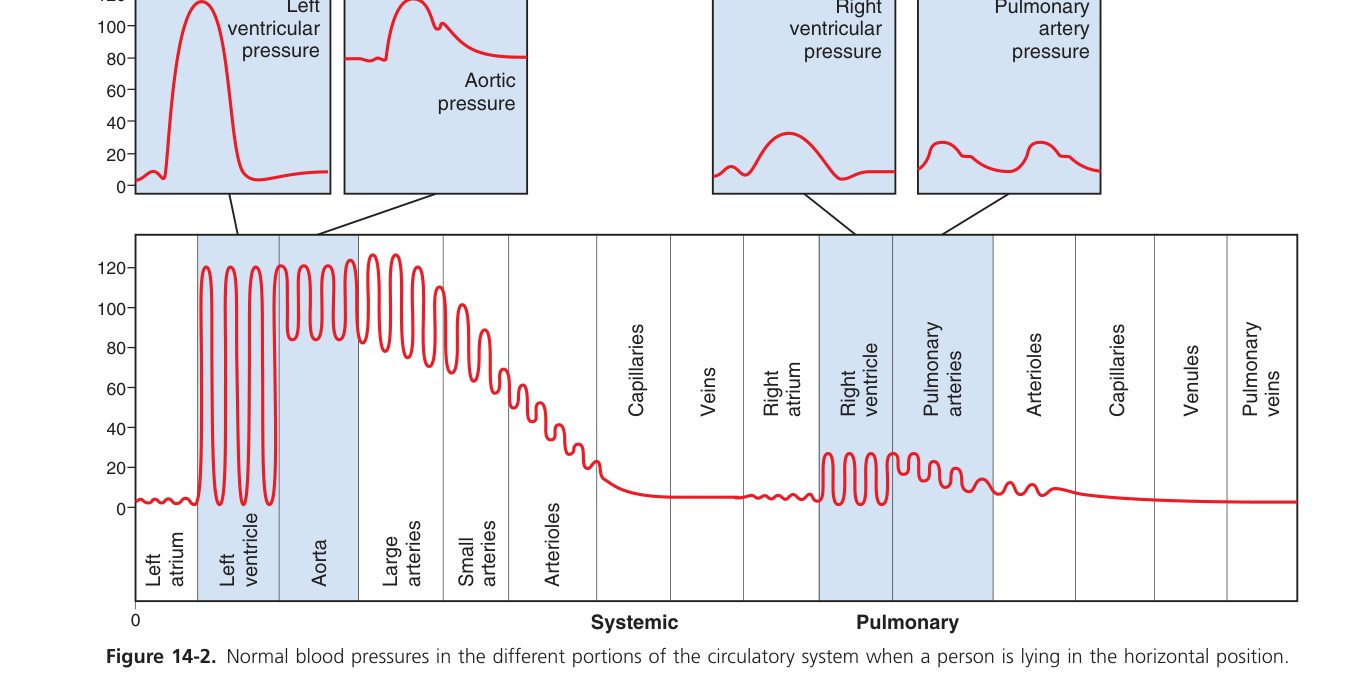
| Vessel | Functional name | Role |
|---|---|---|
| Aorta & large arteries | Windkessel / cushioning vessels | Elastic recoil smooths pulsatile flow into steady flow |
| Small arteries & arterioles | Resistance vessels | Main site of peripheral resistance & biggest pressure drop; control flow |
| Capillaries | Exchange vessels | Single endothelial layer → exchange of gases/nutrients |
| Veins & venules | Capacitance / volume vessels | Thin, compliant; hold ~60–70% of blood volume |
When you take a blood pressure, you are measuring two numbers and they mean two different things. The top number (systolic, ~120 mmHg) is the peak pressure during ventricular ejection — it reflects stroke volume and how stiff the large arteries are. The bottom (diastolic, ~80 mmHg) is the trough during ventricular filling — it reflects how fast blood drains out through the arterioles, so it tracks peripheral resistance. The difference is the pulse pressure, and the average over the whole cycle is the mean arterial pressure (MAP ≈ diastolic + ⅓ pulse pressure). MAP is what perfuses your organs — it’s the BP number that matters most in shock and intensive care. Practical rule that every clinician carries: MAP = CO × TPR. Raise CO or TPR and BP rises; drop either and BP drops. Almost every antihypertensive drug nudges one or the other.
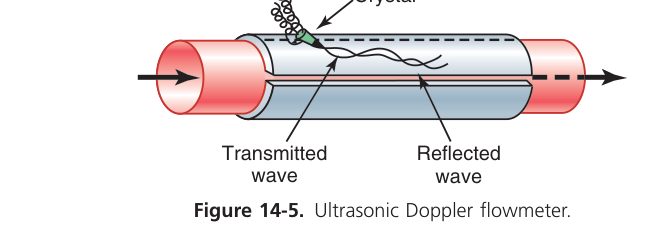
- Systolic (SBP ~120 mmHg) = peak during rapid ejection; diastolic (DBP ~80 mmHg) = trough in diastole.
- Pulse pressure = SBP − DBP (~40 mmHg). Mean arterial pressure (MAP) ≈ DBP + ⅓ pulse pressure (~93 mmHg).
- Determinants of arterial BP: stroke volume, heart rate, peripheral resistance, large-artery compliance, and the blood-volume / vascular-capacity ratio. (↑SV mainly raises SBP; ↑resistance mainly raises DBP; stiff arteries widen pulse pressure.)
- Central venous pressure (CVP) = pressure in the right atrium & great thoracic veins; normally close to zero (can be slightly negative, ~−4 mmHg; clinically ~4–12 cmH₂O). It reflects the balance of venous return vs the heart’s pumping ability.
- CVP rises in cardiac insufficiency (poor pumping) or excessive venous constriction/over-transfusion; it guides the rate & volume of IV fluid therapy.
- Venous return is aided by the muscle pump, respiratory pump, venous valves, and sympathetic venoconstriction; gravity adds 0.77 mmHg per cm below heart level.
• Site of biggest pressure drop? → arterioles (resistance vessels)
• Vessels holding most blood at rest? → veins (~60-70% — capacitance vessels)
• Normal CVP? → ~0 (clinical 4-12 cmH₂O); ↑ in heart failure / fluid overload
• Three aids to venous return? → muscle pump, respiratory pump, venous valves
Microcirculation & Capillary Exchange
The whole reason you have a circulation is to deliver O₂ and nutrients to cells — and that exchange happens at one place: the capillary. Capillaries are absurdly thin (one endothelial cell) and absurdly numerous (~10 billion in a single human body), so the total surface area for exchange is enormous and the distance to the nearest cell is tiny. Gases and small lipid-soluble molecules cross by simple diffusion, the bulk transport job. But water and small solutes also move in and out by bulk flow, governed by a balance of four forces that Starling described in 1896. Capillary hydrostatic pressure and interstitial colloid osmotic pressure push fluid OUT (filtration); plasma colloid osmotic pressure and interstitial hydrostatic pressure pull it IN (reabsorption). Across most capillaries, slightly more fluid filters out than is reabsorbed; the excess is collected by the lymphatic system and returned to circulation. Lose this balance — raise capillary hydrostatic pressure (heart failure), lower colloid (low albumin), or block lymphatics — and fluid accumulates in tissue: oedema.
Capillaries (one cell thick) exchange materials by diffusion (the main route for gases & small solutes), plus filtration / reabsorption of fluid governed by the four Starling pressures. Flow is gated by pre-capillary sphincters.
Filtration = fluid movement driven by a pressure difference from blood into the interstitium. Colloid osmotic pressure (plasma protein, mainly albumin) is what pulls fluid back in — it maintains the capillary–interstitial water balance.
Oedema results when filtration exceeds reabsorption: ↑P₋ (heart failure, venous obstruction), ↓π₋ (hypoalbuminaemia — liver/renal disease, malnutrition), ↑capillary permeability (inflammation), or lymphatic blockage.
Regulation of the Circulation
Your blood pressure changes within seconds when you stand up, exercise, or lose blood — and the body must compensate just as fast or you will pass out. The instrument that does this is the baroreceptor reflex. Stretch receptors in the wall of the carotid sinus and aortic arch sense arterial pressure as wall stretch. Their signal travels via cranial nerves IX and X to the brainstem (nucleus tractus solitarius in the medulla). When BP rises, baroreceptor firing rises, the medulla cuts back sympathetic outflow and ramps up parasympathetic outflow → heart slows, contractility eases, vessels dilate, BP falls back. When BP drops, the opposite happens — vessels constrict, heart speeds and squeezes harder. This is why standing from supine produces a tiny transient BP dip that you don’t notice; the reflex catches it. When the reflex fails (autonomic neuropathy, dehydration, α-blocker overdose), you get postural hypotension — dizziness and fainting on standing.
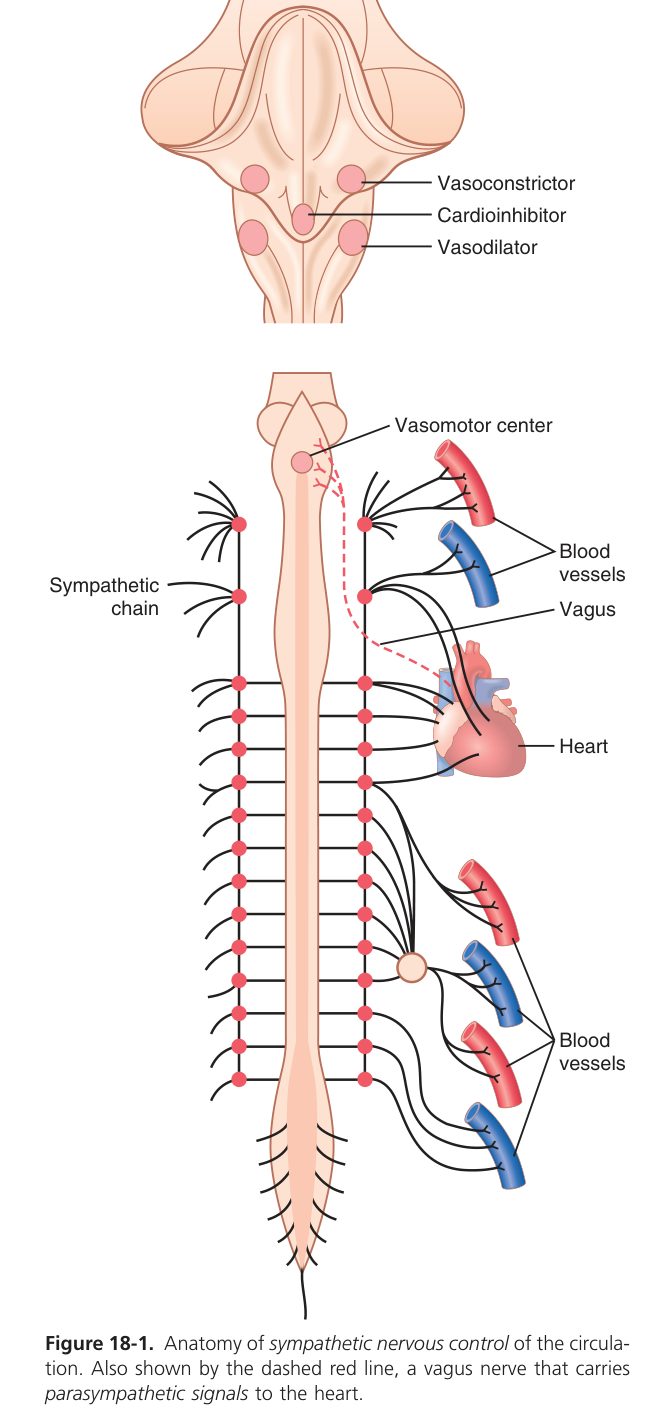
- Receptors: stretch (pressure) receptors in the carotid sinus & aortic arch — firing rate ∝ arterial pressure & pulse pressure.
- Centre: the medullary cardiovascular (vasomotor) centre — in the medulla, NOT the cortex.
- Response to ↑BP: ↑baroreceptor firing → ↑parasympathetic (vagal) outflow to heart + ↓sympathetic outflow to heart/arterioles/veins → ↓HR, ↓contractility, vasodilation, venodilation → ↓BP (negative feedback). The reverse on haemorrhage/↓BP.
- The baroreceptor reflex is a short-term (rapid) regulator of arterial pressure.
Chemoreceptors (carotid & aortic bodies) respond to ↓O₂, ↑CO₂, ↓pH → stimulate the vasomotor centre → ↑BP & ventilation.
Sympathetic stimulation (noradrenaline on β₁ receptors → cAMP) produces:
- Positive chronotropic effect — ↑heart rate (faster phase-4 depolarisation in the SA node).
- Positive inotropic effect — ↑contractility/force (more Ca²⁺ entry).
- (also positive dromotropic — faster AV conduction.) Vagal stimulation does the opposite.
Renin–Angiotensin–Aldosterone System (RAAS) — the key response to hypotension / hypovolaemia:
Angiotensin II: strong vasoconstrictor; stimulates aldosterone; promotes proximal tubular Na⁺ reabsorption; stimulates smooth-muscle proliferation & thirst/ADH. (It does NOT raise GFR — it constricts and tends to lower it.)
| Vasoconstrictors | Vasodilators |
|---|---|
| Angiotensin II, endothelin, noradrenaline (α), thromboxane A₂, vasopressin (ADH) | Nitric oxide (NO), prostaglandins (PGI₂), bradykinin, ANP, histamine, adenosine |
The dominant long-term regulator of arterial pressure is blood volume, set by the kidneys: a rise in arterial pressure increases renal excretion of salt & water (pressure natriuresis) → ↓volume → ↓venous return → ↓CO → pressure returns toward normal.
This is why RAAS / volume drives chronic hypertension, and why ACE inhibitors, ARBs and diuretics are first-line treatments. After haemorrhage: ↓BP → baroreflex (↑HR, ↑contractility, vasoconstriction, ↑TPR) + RAAS + ADH restore pressure short- and long-term.
Cardiovascular complete
Electrophysiology, cardiac cycle, output, ECG, vessels & regulation mastered. Next: Respiratory.